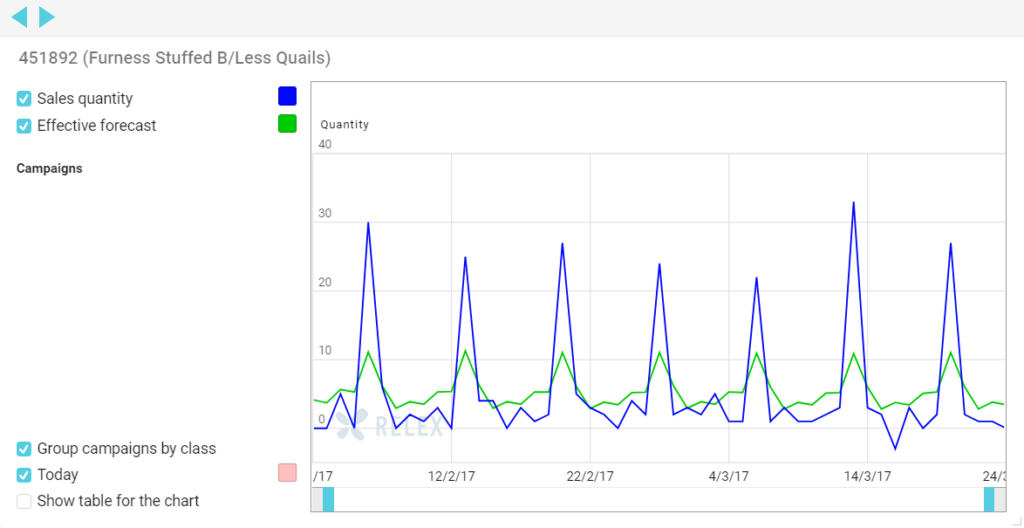
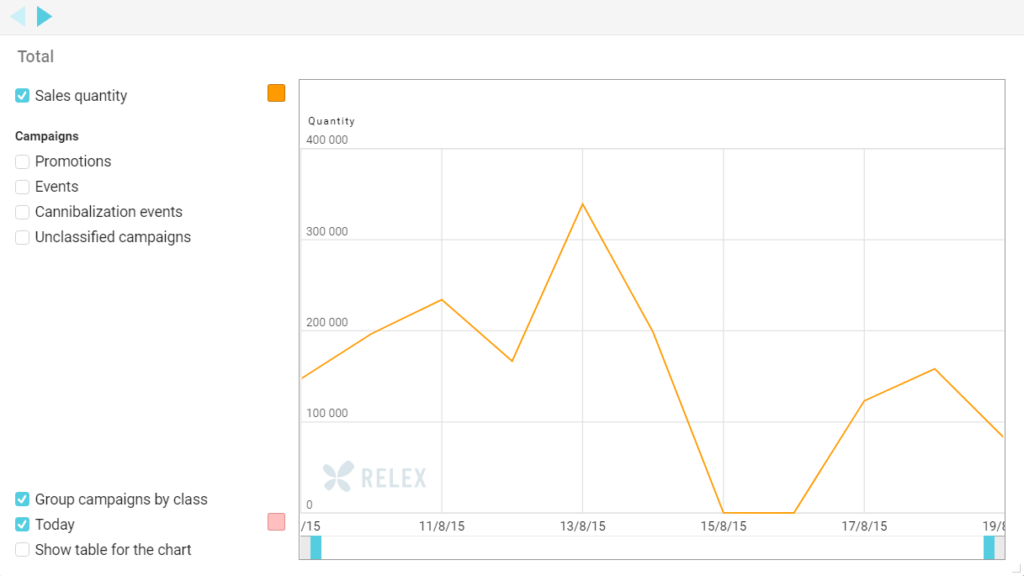
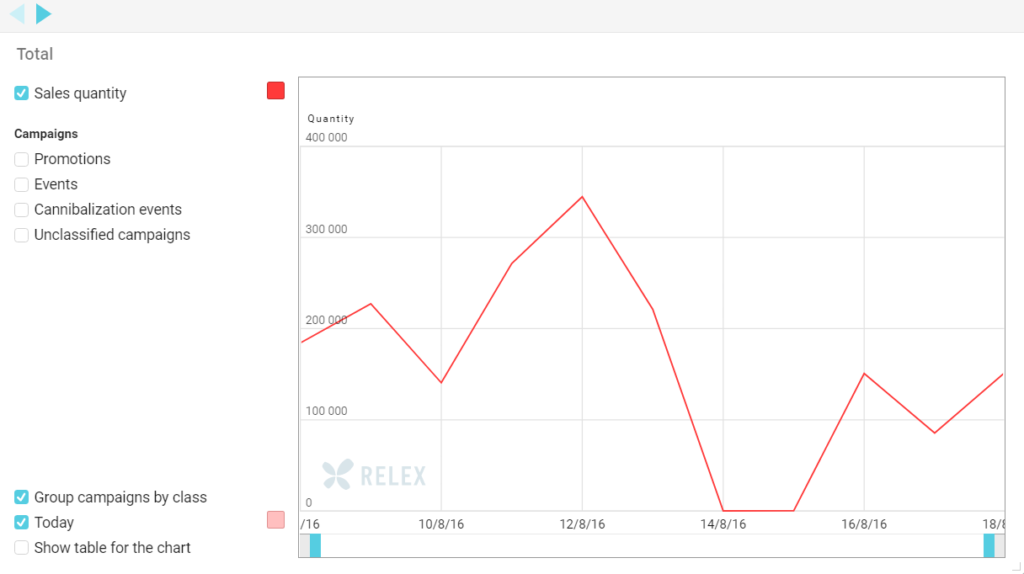
With fresh food forecasting and replenishment, the short shelf life of items makes accuracy essential. As sales fluctuate significantly day to day, precision is only possible through daily forecasting and daily replenishment. Let’s take a look at the practical building blocks that underpin this: weekday profiles, dynamic daily safety stocks, delivery schedules and efficient ways to manage them.
1. Identify Weekly Patterns and Use Them in Your Forecasts
There are people who always eat pizza on Saturday evenings and a roast on Sundays. Not everyone is quite that predictable, but analyze the data for larger customer groups – e.g. all consumers shopping in one store – and you can see patterns emerge and identify different shopping habits for each day of the week.
Weekday profiles simply capture how the weekly demand is spread over each day of the week. The profiles are essentially percentages defining what proportion of weekly sales is expected to be sold on each day. For instance, if Friday is setup within a profile at 50%, this means half of the week’s total sales is forecast to be made on Friday when customers shop for the weekend. There are occasions when it makes sense to create profiles manually, but generally it’s more effective to harness automated statistical tests to mine the profile data for each product, i.e. automatically recognize the demand patterns for weekdays and assign the correct proportion to each day.
2. Find the Right Calculation Level for Weekday Profiles – Go Low
The basics of creating the weekday profiles for individual lines seems pretty simple – the system just calculates what percentage of the week’s sales are made on each day of the week. However there needs to be significant sales of an item at a particular store to provide sufficient data to create a reliable profile. In practice SKU-Store-level profiling works best for products that sell every day. For the other products, you have to aggregate data from across stores to arrive at a statistically significant data set and avoid the possibility of the profile becoming random.
The two easiest ways to aggregate data are to combine figures for lines in the same product group, or combining sales for multiple stores. Whether by product or by stores it’s important to aggregate at a level where the demand profiles of the products are quite similar. For example, in packed meat, ‘basic’ products such as packed chicken and ‘premium’ type products such as beef fillet often have quite different sales profiles. Not surprisingly, weekday profiling can often be improved by splitting a larger product group into sub–categories, for example by price point. Also, when aggregating data across a number of stores, it is important to take individual store profiles into account, especially if they’re smaller outlets. If a smaller store serves a sparsely populated area, and is the main shopping outlet for many of its customers, weekday profiles may be quite different than if it has a convenience store profile where shoppers just top up. For example, fresh milk sales will probably peak on Fridays and weekends where a store is a primary shopping destination, but on Mon-Weds if it’s treated as a convenience outlet.
As a good rule of thumb, we suggest using profiling at as low a level as possible. In practice, seek the lowest level where you have unbroken sales data for all days.
3. Find out Whether the Day-profiling Level Is Incorrect
The forecast for normal sales days usually consists of two components – the weekly forecast and the day-level split with the profile. We have found tracking and analyzing day-level forecast accuracy in tandem with weekly level accuracy, is the best way to identify problems arising from inadequate day profiling. Looking at the same data at different levels – SKU-store, Product Group-Store, or SKU-Chain – often helps finding out at what point errors creep in.

4. Build Capability for Day-level Safety Stock
The first principle of forecasting is that the forecast always contains a margin of error. This principle holds true even if you have calculated highly accurate weekday profiles using the right level of data aggregation. So, to reach the desired shelf-availability levels, we need safety stock to account for that margin of error.
Safety-stock levels can be scaled to demand forecasts simply by setting safety stock in terms of days-of-forecast demand, e.g. 0.2 days for each day. However, forecast accuracy for each weekday often varies, as sales volumes vary, and so safety stock needs to cover those eventualities to maintain the desired shelf availability. We have found it helps to calculate day-level safety stock for products with differing day-level forecast accuracy.
Another thing that often makes sense to take into account in safety stock management is delivery patterns. In many retail chains, delivery patterns change over the weekend, and some smaller stores sometimes have only a few delivery days each week, even for fresh products. In those cases, you may decide to profile safety stock differently where delivery intervals are longest, as they present the biggest risk of spoilage.
5. Remember That Some Weeks Are Different
A retailer’s year is full of exceptional sales situations. To forecast normal sales accurately, you need to segregate promotional and holiday sales from your normal weekly profiles. However, you also have to be able to predict accurately the near insatiable appetites of holiday shoppers.
Public holidays have a huge impact on demand volume for some products and just as importantly on the weekly sales profile of all products. They profoundly change the way in which people shop for food.
We have found that weekday profiling for ‘steady holidays’ such as bank holidays or Easter – which fall on the same days of the week – is usually very effective as it’s based on previous years’ data and can be automated. The weekday profiles for holiday weeks (often also the weeks before and after) are also calculated from historic data, and are assigned for those holiday weeks based on user set rules. Typically however, Christmas is more difficult, as you often have to look as far back as five years to find a comparable week – and the market usually has changed in that time. Several of our customers have found that, for Christmas, day-level review and adjustment of forecasts based on, for example, a store cluster level is generally the most effective way of managing them.


Accurate Daily Replenishment Requires the Right Tools
So we’ve offered you five building blocks with which to lay the foundations for better daily replenishment forecasting. What you’ll no doubt have picked up on is that all five are asking supply chain professionals to dive deeper into their data. By increasing the granularity of the analysis, it’s possible to detect demand patterns that would effectively be invisible from a higher level.
And it’s the mastery of these patterns-within-patterns that is vital. With short-shelf-life items there’s very little margin for error. Indeed, errors quickly destroy margins.
This need for detailed analysis inevitably has implications when it comes to choosing tools for the job. Obviously, it underscores how far we’ve moved beyond the capabilities of teams using spreadsheets. But these sorts of calculations also put a huge strain on more advanced systems. It’s not just about whether they have the right functionality. It’s also about whether they have the power.
Waiting for overnight batch processing to spit out the answers won’t cut it. You need to be able to interrogate your system any which way and at any level you choose and get answers immediately.
Thankfully such technology is now available and with the right solution, the right processes and your expertise, highly accurate daily replenishment is within your reach.
—
If you want to read more about the impact of weekday variations in fresh forecasting & replenishment, read the chapter ‘Refine Your Store Replenishment for Increased Availability, Reduced Waste and Maximum Efficiency’, in our Grocery Retail Supply Chain -best practice guide.


